BMI Calculator for Women: Healthy BMI Range by Height, Weight & Age
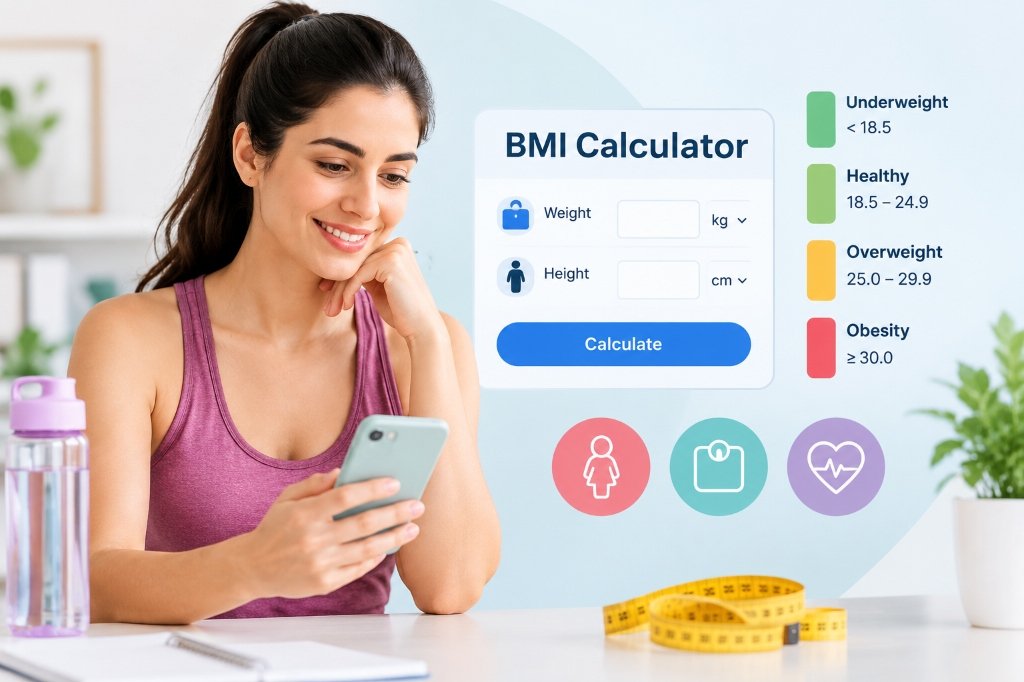
A BMI calculator for women uses your height and weight to estimate your body mass index (BMI). For most adults, the standard BMI formula and BMI categories are the same for women and men, although BMI has notable limitations and needs extra context based on age, pregnancy, body composition, and other factors.
Quick Answer: What Is a Healthy BMI for Women?
For most adult women, a BMI between 18.5 and 24.9 falls inside the standard healthy-weight category defined by the World Health Organization (WHO) and Centers for Disease Control and Prevention (CDC). Keep in mind that BMI is a population screening tool, not a diagnostic test of personal health, body fat percentage, or physical fitness.
- 1. BMI Calculator for Women
- 2. What Is BMI?
- 3. How to Calculate BMI for Women
- 4. What Is a Healthy BMI for Women?
- 5. BMI Chart for Women
- 6. BMI by Height and Weight
- 7. Does BMI Change With Age for Women?
- 8. Is BMI Different for Women and Men?
- 9. BMI for Women Over 50
- 10. BMI and Pregnancy
- 11. BMI for Asian Women
- 12. Why BMI Does Not Tell the Whole Story
- 13. What to Check Alongside BMI
- 14. When to Talk to a Healthcare Professional
- 15. Frequently Asked Questions
- 16. Key Takeaways
1. BMI Calculator for Women
The online tool above gives you a quick, reliable estimate of your Body Mass Index without manual arithmetic. You only need your height and your current weight.
Here is how the calculation works:
- Step 1: Choose your preferred units. Use metric (kilograms and centimeters) or imperial (pounds, feet, and inches).
- Step 2: Enter your weight. Input your morning body weight before breakfast for consistent tracking.
- Step 3: Enter your height. Input your standing height measured barefoot against a flat wall.
- Step 4: Check your numbers. Your BMI score updates immediately alongside your standard category and the healthy weight boundary for your specific stature.
If you want to save your progress, test different scenarios, or look at calorie needs alongside your weight, try our dedicated SmartCalc BMI Calculator and pair it with our daily calorie tool.
2. What Is BMI?
What Does BMI Stand For?
BMI stands for Body Mass Index. Belgian mathematician and statistician Adolphe Quetelet introduced the concept in the 1830s. He originally called it the Quetelet Index, designing it to study average body builds across large European populations rather than diagnosing individual health.
What Does BMI Measure?
BMI measures the relationship between your total body weight and your height. Health authorities worldwide, including the World Health Organization (WHO) and the US Centers for Disease Control and Prevention (CDC), use BMI to identify weight categories that may correlate with increased risks for certain chronic conditions, such as high blood pressure, type 2 diabetes, and cardiovascular strain.
What BMI Does Not Measure
BMI does not measure body fat directly. It places all body mass into one single number. That number combines skeletal muscle, bone mineral content, fluids, internal organs, and adipose fat tissue. Because of this simplicity, two women with the exact same height and weight will receive identical BMI scores, even if one is a competitive sprinter with dense muscle and the other has a sedentary routine with higher body fat.
3. How to Calculate BMI for Women
The mathematical formula for calculating BMI is identical for adult women and adult men. It uses your height squared in the denominator.
BMI Formula in Metric Units
To use this formula, divide your height in centimeters by 100 to get meters. Multiply that number by itself, and then divide your weight in kilograms by that squared result.
BMI Formula in Imperial Units
Convert your total height into inches (for example, 5 feet 5 inches equals 65 inches). Multiply the height in inches by itself, divide your weight in pounds by that number, and multiply the outcome by the conversion factor 703.
Step-by-Step Example Calculation
Worked Example: 60 kg and 165 cm
Step 1: Convert height into meters: 165 cm ÷ 100 = 1.65 m.
Step 2: Square the height: 1.65 × 1.65 = 2.7225 m².
Step 3: Divide weight by height squared: 60 ÷ 2.7225 = 22.038.
Step 4: Round to one decimal place: BMI = 22.0 (Healthy weight category).
For a deeper review of conversions and manual formulas, see our guide on how to calculate BMI using metric and imperial formulas.
4. What Is a Healthy BMI for Women?
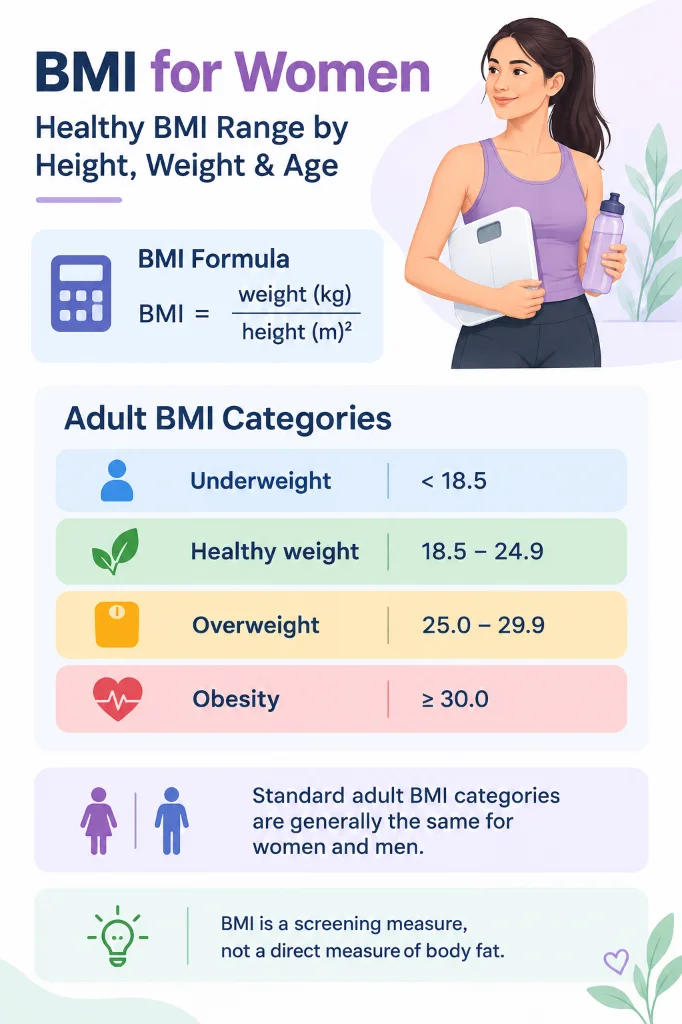
Standard adult guidelines place a healthy BMI between 18.5 and 24.9. These thresholds reflect large clinical studies showing that adults in this weight range generally experience lower incidence rates of weight-related metabolic problems.
Standard Adult BMI Categories
| BMI Range | Standard Weight Category | Clinical Health Context |
|---|---|---|
| Below 18.5 | Underweight | Increased risk for nutrient deficiencies, weakened immune function, and bone density loss. |
| 18.5 – 24.9 | Healthy Weight | Lowest statistical risk for cardiovascular disease, hypertension, and metabolic syndrome. |
| 25.0 – 29.9 | Overweight | Moderate elevation in risk for elevated blood sugar, joint strain, and cardiovascular issues. |
| 30.0 – 34.9 | Obesity (Class 1) | Higher risk of insulin resistance, sleep apnea, fatty liver, and high blood pressure. |
| 35.0 – 39.9 | Obesity (Class 2) | Substantially higher risk of metabolic illness and cardiac workload. |
| 40.0 and above | Obesity (Class 3) | Severe clinical risk; medical evaluation and personalized support strongly recommended. |
Keep in mind that these standard categories apply to general adult populations. They do not mean that every person with a BMI of 25.1 has poor health, nor that every person at 21.0 has ideal metabolic markers.
5. BMI Chart for Women
This reference chart shows the healthy weight boundaries (BMI 18.5 to 24.9) across common adult female heights. Each row provides minimum and maximum healthy weights in both kilograms and pounds.
Healthy Weight Range by Height
| Height (cm) | Height (ft & in) | Healthy Weight Range (kg) | Healthy Weight Range (lbs) | Overweight Starts At |
|---|---|---|---|---|
| 145 cm | 4'9" | 38.9 – 52.3 kg | 86 – 115 lbs | 52.5 kg (116 lbs) |
| 150 cm | 4'11" | 41.6 – 56.0 kg | 92 – 123 lbs | 56.3 kg (124 lbs) |
| 152 cm | 5'0" | 42.7 – 57.5 kg | 94 – 127 lbs | 57.8 kg (128 lbs) |
| 155 cm | 5'1" | 44.4 – 59.8 kg | 98 – 132 lbs | 60.1 kg (133 lbs) |
| 157 cm | 5'2" | 45.6 – 61.4 kg | 101 – 135 lbs | 61.6 kg (136 lbs) |
| 160 cm | 5'3" | 47.4 – 63.7 kg | 104 – 140 lbs | 64.0 kg (141 lbs) |
| 163 cm | 5'4" | 49.2 – 66.2 kg | 108 – 146 lbs | 66.4 kg (147 lbs) |
| 165 cm | 5'5" | 50.4 – 67.8 kg | 111 – 149 lbs | 68.1 kg (150 lbs) |
| 168 cm | 5'6" | 52.2 – 70.3 kg | 115 – 155 lbs | 70.6 kg (156 lbs) |
| 170 cm | 5'7" | 53.5 – 72.0 kg | 118 – 159 lbs | 72.3 kg (160 lbs) |
| 173 cm | 5'8" | 55.4 – 74.5 kg | 122 – 164 lbs | 74.8 kg (165 lbs) |
| 175 cm | 5'9" | 56.7 – 76.3 kg | 125 – 168 lbs | 76.6 kg (169 lbs) |
| 178 cm | 5'10" | 58.6 – 78.9 kg | 129 – 174 lbs | 79.2 kg (175 lbs) |
| 180 cm | 5'11" | 59.9 – 80.7 kg | 132 – 178 lbs | 81.0 kg (179 lbs) |
| 185 cm | 6'1" | 63.3 – 85.2 kg | 140 – 188 lbs | 85.6 kg (189 lbs) |
How to Read the Chart
Find your height in the left column. The middle two columns show the range of weights that keep you within the standard healthy category. If your weight is below the minimum column, you fall into the underweight category; if it is above the overweight threshold, your BMI sits at 25 or higher.
BMI Chart vs. Healthy Weight Chart
A pure BMI chart relies strictly on mathematical ratios between weight and height. Traditional healthy weight charts or actuarial tables often tried to incorporate frame size (small, medium, or large bone frames). While frame size changes lean bone mass by a few kilograms, modern clinicians favor measuring waist circumference alongside a BMI chart because visceral fat around the abdomen presents a clearer health indicator than wrist or elbow breadth.
6. BMI by Height and Weight
To understand how small changes in weight influence your final score, look at these practical examples across popular female heights:
BMI for a Woman Who Is 150 cm (4'11")
At 150 cm, the healthy weight window is 41.6 kg to 56.0 kg (92 to 123 lbs). If she weighs 50 kg, her BMI is 22.2 (healthy). If her weight reaches 58 kg, her BMI climbs to 25.8, crossing into the overweight bracket. Because shorter statures have a smaller denominator, a difference of just 3 to 4 kilograms has a noticeable impact on the calculated BMI.
BMI for a Woman Who Is 160 cm (5'3")
At 160 cm, the healthy weight band spans from 47.4 kg to 63.7 kg (104 to 140 lbs). A woman weighing 55 kg has a BMI of 21.5. If she weighs 62 kg, her BMI is 24.2, which remains inside the healthy zone.
BMI for a Woman Who Is 165 cm (5'5")
At 165 cm (the average female height in many regions), the healthy weight span is 50.4 kg to 67.8 kg (111 to 149 lbs). A weight of 60 kg yields a BMI of 22.0. A weight of 72 kg produces a BMI of 26.4 (overweight).
BMI for a Woman Who Is 170 cm (5'7")
At 170 cm, the healthy range is 53.5 kg to 72.0 kg (118 to 159 lbs). A weight of 65 kg equals a BMI of 22.5. At 75 kg, her BMI is 26.0.
BMI for a Woman Who Is 175 cm (5'9")
At 175 cm, the healthy range expands to 56.7 kg to 76.3 kg (125 to 168 lbs). At 70 kg, the BMI is 22.9. Taller frames can distribute more absolute kilograms across their height before their BMI category shifts.
7. Does BMI Change With Age for Women?
Many readers search for a "BMI calculator by age and gender." The mathematical formula itself does not change with age for adult women. A 25-year-old woman and a 65-year-old woman measuring 165 cm and weighing 65 kg will both have a BMI of 23.9.
However, the biological composition of the body changes across decades, which is why doctors interpret that number differently depending on your life stage:
BMI in Your 30s
Basal metabolic rate drops slightly as natural growth hormone production levels out. Lifestyle changes, workplace routines, and family demands often alter daily activity levels. While standard BMI guidelines remain completely valid, paying attention to muscle tone and aerobic activity helps prevent gradual weight gain.
BMI in Your 40s
During perimenopause, shifting estrogen and progesterone levels can alter where the body deposits adipose tissue. Many women notice fat moving away from the hips and thighs toward the lower abdomen. Even if total body weight and BMI remain stable, body composition may shift toward higher fat and lower lean mass.
BMI in Your 50s and Beyond
Following menopause, estrogen levels drop substantially. Muscle mass naturally declines at an accelerated rate unless counteracted with regular resistance training. For older women, clinical research in geriatric medicine suggests that being at the lower edge of the healthy range (such as a BMI below 20) may increase the risk of osteoporosis, hip fractures, and frailty.
8. Is BMI Different for Women and Men?
The calculation is the same, but male and female body composition profiles differ substantially:
- Higher Essential Body Fat: Women naturally require more essential fat for normal reproductive, hormonal, and endocrine function. Essential body fat in healthy women sits around 10% to 13%, compared to 2% to 5% in men.
- Total Healthy Fat Percentages: A healthy body fat percentage for adult women is generally 21% to 32%, whereas for adult men it is typically 8% to 19%.
- Same BMI, Different Fat Mass: At an identical BMI of 23.0, an average woman carries more adipose fat tissue and less skeletal muscle than a man of the same age and height.
This fundamental biological difference explains why so many people search specifically for a "female BMI calculator." While the math formula does not separate the sexes, interpreting the results requires understanding female physiology.
9. BMI for Women Over 50
Women over 50 face specific physiological transitions that make relying only on the bathroom scale misleading:
- Sarcopenia (Loss of Muscle): Adults lose between 3% and 8% of muscle mass per decade after age 30, with higher losses after age 60. When muscle diminishes, a woman may maintain the same BMI while her body fat percentage rises.
- Bone Mineral Density: Estrogen loss during post-menopause accelerates bone mineral reduction. Being underweight (BMI below 18.5) or even close to the lower cutoff is a known risk factor for osteopenia, osteoporosis, and severe fall injuries.
- Normal-Weight Obesity: A woman over 50 can sit at a "healthy" BMI of 22.5 but carry higher visceral fat around internal organs, accompanied by elevated blood glucose or triglycerides.
For women in this age group, geriatricians often favor staying between a BMI of 22 and 27, while focusing on daily protein intake, resistance training, and waist measurements rather than aggressive calorie restriction.
10. BMI and Pregnancy
Standard adult BMI charts should not be used to evaluate weight gain during active pregnancy. Gestational weight gain includes the growing baby, the placenta, amniotic fluid, increased maternal blood volume, uterine tissue, and breast tissue.
Instead, obstetricians use your pre-pregnancy BMI to determine how much total weight you should safely gain over the full term:
| Pre-Pregnancy BMI Category | Pre-Pregnancy BMI | Recommended Full-Term Gain (Single Pregnancy) |
|---|---|---|
| Underweight | Below 18.5 | 28 – 40 lbs (12.5 – 18.0 kg) |
| Healthy Weight | 18.5 – 24.9 | 25 – 35 lbs (11.5 – 16.0 kg) |
| Overweight | 25.0 – 29.9 | 15 – 25 lbs (7.0 – 11.5 kg) |
| Obesity | 30.0 or higher | 11 – 20 lbs (5.0 – 9.0 kg) |
If you are expecting or planning, calculate your estimated delivery date with our Pregnancy Due Date Calculator and read our guide on how to calculate your pregnancy due date.
11. BMI for Asian Women
Research compiled by the World Health Organization shows that many Asian populations have a higher percentage of body fat and higher levels of visceral abdominal fat at lower BMI values compared to European populations.
As a result, health risks such as type 2 diabetes, fatty liver disease, and coronary heart disease begin climbing at lower body weights. The WHO Expert Consultation outlined revised action points for Asian adults:
- Below 18.5: Underweight (nutritional risk)
- 18.5 – 22.9: Healthy / Normal weight (low risk)
- 23.0 – 27.4: Overweight / Increased risk
- 27.5 and above: Obese / High risk
If you are of South Asian, East Asian, or Southeast Asian heritage, keeping your BMI under 23.0 and monitoring your waistline provides a safer preventive health target than waiting until a standard BMI of 25.0.
12. Why BMI Does Not Tell the Whole Story
While BMI is useful for population surveys and initial checkups, it has clear clinical shortcomings when applied to individuals:
- Muscle vs. Fat Confusion: Muscle tissue is roughly 18% denser than fat tissue. Athletic women with high muscle volume may receive an "overweight" score despite low body fat and strong cardiovascular health.
- Location of Body Fat: Subcutaneous fat on the hips and thighs (the common "pear" shape) is metabolically distinct from visceral fat stored deep inside the abdominal cavity around internal organs (the "apple" shape). Visceral fat releases inflammatory cytokines that elevate heart disease risk. BMI cannot see where fat is stored.
- Bone Density Variations: Differences in bone thickness and frame size can alter total scale weight without changing body fat percentage.
- Screening vs. Diagnostic Tool: A screening tool points toward areas that may need a closer look. A high or low BMI is an invitation to examine broader health markers, not a definitive health diagnosis.
13. What to Check Alongside BMI
To get a clearer, more complete picture of your physical well-being, review these measures alongside your BMI score:
- Waist Circumference: Measure your waist just above your hip bones at the end of a normal exhale. For women, a waist circumference over 35 inches (88 cm)—or over 31.5 inches (80 cm) for Asian women—correlates with higher visceral fat and cardio-metabolic risk.
- Waist-to-Height Ratio (WHtR): Divide your waist circumference by your standing height. A ratio below 0.50 (meaning your waist is less than half your height) indicates lower risk across both sexes and all ages.
- Blood Pressure: A standard reading below 120/80 mmHg confirms healthy vascular function.
- Metabolic Blood Panels: Fasting blood glucose, HbA1c, triglycerides, and HDL ("good") cholesterol provide direct insight into insulin sensitivity and arterial health.
- Daily Habits: Consistent physical activity, balanced nutrition, sufficient sleep, and staying hydrated using our daily water intake tool play a bigger role in longevity than raw scale weight.
14. When to Talk to a Healthcare Professional
Online calculators offer guidance, but personalized medical advice requires an evaluation by a physician, registered dietitian, or endocrinologist. Make an appointment if you experience any of the following:
- A BMI consistently below 18.5 accompanied by fatigue, hair thinning, irregular periods, or cold intolerance.
- Rapid, unexplained weight loss or gain without deliberate changes in diet or physical activity.
- A BMI above 30 combined with joint pain, breathlessness during light activity, or family history of heart disease or diabetes.
- Concerns related to polycystic ovary syndrome (PCOS), thyroid disorders, or perimenopausal hormone shifts.
- Feelings of anxiety, distress, or compulsive behaviors surrounding food, calories, or the bathroom scale.
15. Frequently Asked Questions About BMI for Women
According to the World Health Organization (WHO) and the CDC, a healthy BMI for adult women is between 18.5 and 24.9. In this range, statistical risk for heart disease, high blood pressure, and type 2 diabetes is lowest.
No. The mathematical calculation uses the same formula for adult women and adult men: weight in kilograms divided by height in meters squared. However, women naturally carry higher essential body fat percentages than men at the exact same BMI.
A standard healthy BMI for a 30-year-old woman is between 18.5 and 24.9. Maintaining a waist-to-height ratio below 0.50 and staying active will provide even stronger protection for long-term metabolic health.
While standard guidelines list 18.5 to 24.9 for all adults, clinical studies in older populations suggest that a slightly higher BMI of 22.0 to 27.0 may offer protection against bone loss, fracture complications, and nutritional decline after menopause.
There is no single "ideal" number that fits every woman. Most health organizations regard the middle of the healthy range (around 20.5 to 23.0) as an optimal zone for low disease risk, provided blood pressure, glucose, and physical fitness remain strong.
In metric units, divide your weight in kilograms by your height in meters squared. In imperial units, divide your weight in pounds by your height in inches squared, and multiply the result by 703. You can also use our live calculator above for instant results.
For a woman measuring 5 feet 4 inches (163 cm), a standard healthy weight range (BMI 18.5 to 24.9) is between 108 pounds and 146 pounds (49.2 kg to 66.2 kg).
The calculation formula does not change for adults over 20. However, body composition naturally shifts with age: muscle mass tends to decrease and body fat tends to increase, meaning an older adult may have higher body fat than a younger adult with the same BMI.
Yes, in clinical practice. The World Health Organization identifies that Asian adults face higher risks of cardiovascular disease and diabetes at lower BMI cutoffs. For Asian women, a BMI of 23.0 to 27.4 is considered overweight, and 27.5 or higher indicates obesity risk.
BMI is often inaccurate for muscular athletes, bodybuilders, and fitness competitors. Because muscle tissue is denser than fat, muscular women can be categorized as "overweight" or "obese" despite having low body fat and strong metabolic markers.
No, standard adult BMI categories should not be used to track pregnancy weight gain. However, doctors use your pre-pregnancy BMI to determine a healthy target for total weight gain throughout the pregnancy.
BMI is a general ratio of weight to height. Body fat percentage measures the actual percentage of your total mass that consists of fat tissue compared to lean muscle, bone, and organs.
BMI is a useful screening tool, but it cannot assess health on its own. True health depends on blood pressure, blood glucose, cholesterol, cardiorespiratory fitness, sleep quality, and lifestyle habits.
The standard healthiest statistical range is 18.5 to 24.9 for most adults, and 18.5 to 22.9 for adults of Asian ancestry.
16. Key Takeaways
- Same math, different biology: The standard BMI formula is identical for women and men, but women naturally carry higher essential fat for hormonal balance.
- Standard healthy range: A BMI of 18.5 to 24.9 represents the standard healthy range for most adult women.
- Asian thresholds: For women of Asian heritage, health risks often begin above a BMI of 23.0.
- Age and menopause: While the formula stays constant with age, muscle loss and fat redistribution after menopause make waist circumference a critical companion metric.
- Pregnancy requires separate guidelines: Standard BMI does not track gestational weight gain; pre-pregnancy BMI sets target weight goals.
- Screening, not diagnosis: Use your BMI score as an informative starting point, not a final judgment of your health or self-worth.
- Centers for Disease Control and Prevention (CDC). About Adult BMI. Available at: cdc.gov/bmi/adult-calculator/bmi-categories.html
- World Health Organization (WHO). Body Mass Index - BMI Guidelines and Classifications. Available at: who.int/data/gho/data/themes/topics/topic-details/GHO/body-mass-index
- WHO Expert Consultation. Appropriate body-mass index for Asian populations and its implications for policy and intervention strategies. The Lancet, 2004; 363(9403): 157-163.
- National Heart, Lung, and Blood Institute (NHLBI / NIH). Managing Overweight and Obesity in Adults: Systematic Evidence Review from the Obesity Expert Panel. Available at: nhlbi.nih.gov
- American College of Obstetricians and Gynecologists (ACOG). Weight Gain During Pregnancy: Committee Opinion No. 548. Available at: acog.org